
Timeline Examples For Learning, Projects, And Presentations
Timelines help us track progress, set priorities, and see results. The right timeline examples can make even the most complicated projects, learning paths, or presentations much easier to follow. For Instructional Designers, L&D leaders, and learning architects, timelines are useful tools for organizing onboarding, training, and strategic projects. Whether you are launching a course or getting stakeholders on the same page about milestones, knowing how to make a timeline effectively can improve both clarity and execution. The goal is simple: help you think more clearly, visualize processes, and plan with confidence.
In this article, you will find practical timeline ideas, real timeline examples, and step-by-step instructions for building timelines with tools like Google Docs, PowerPoint, and Excel. There are also tips on designing and choosing the right format for your needs. Ready to get started?
Table Of Contents
What Is A Timeline?
A timeline is a visual way to organize events, milestones, or tasks over a specific period. Timeline examples help people see what happens, when it happens, and how different steps connect.
There are different examples of timelines, each serving a distinct purpose. Project timelines focus on tasks, deadlines, and dependencies, helping teams manage deliverables and stay aligned. Learning timelines are commonly used in L&D to map out training programs, onboarding journeys, or course progressions. They show how knowledge builds over time. Presentation timelines, on the other hand, are designed for storytelling, summarizing key events, strategies, or company growth in a clear, engaging format.
Overall, timelines help L&D professionals organize course design, structure onboarding, and clearly share learning paths with stakeholders. Reviewing timeline examples can also highlight useful patterns and best practices for better planning and delivery.
Timeline Examples: Use Cases In Professional Learning And Projects
For professionals in L&D, HR, and content design, timeline examples help turn complex processes into clear, structured narratives. Whether you are designing a learning journey, managing a project, or presenting outcomes, the right timeline makes your message easier to understand and act on. Let’s take a look at key timeline examples and use cases in the industry.
Learning Journeys And Course Design
In learning design, timelines are essential for mapping experiences over time. Instructional Designers often use them to structure onboarding programs, define course modules, and sequence microlearning content. Instead of presenting isolated lessons, a timeline shows how learning builds progressively.
For instance, a leadership development program could last six months. Creating a timeline with key milestones, like the initial assessment, core skill modules, coaching sessions, and final evaluation, helps learners stay on track and lets stakeholders see how the program is structured.
These types of timeline examples for students and professionals are especially useful in blended learning environments. You can also experiment with creative timeline ideas, such as branching paths for different learner personas or visual progress trackers inside an LMS.
Project Management And Planning
Timelines are equally critical in project execution. They provide a clear overview of milestones, deadlines, and dependencies, helping teams stay aligned and accountable.
In practice, many teams rely on project timeline examples built in tools like Excel or Google Docs. A simple project timeline template can map deliverables across weeks or months, making it easier to track progress and identify bottlenecks early. For L&D teams, this is particularly useful when managing course development, content production, or system implementations.
The key advantage here is visibility. A well-structured timeline ensures that everyone, from designers to stakeholders, shares the same expectations around timing and outcomes.
Presentations And Reporting
When it comes to communication, timelines become powerful storytelling devices. Instead of listing updates, professionals can visually present progress, strategy, or impact over time.
For instance, presentation timeline examples are often used in executive briefings to show how an initiative evolved, from planning to execution to results. A well-designed timeline can highlight key milestones without overwhelming the audience.
Similarly, company timelines are a useful way to show growth, change, or strategic direction. They help leaders link past actions to future goals, which makes the story clearer and more engaging.
Timeline Design Principles
Strong timeline design is not about making something look good, but about making information easier to understand, faster to process, and more effective to act on. For professionals designing learning journeys, onboarding flows, or project plans, clarity always comes first.
Readability
Focus on making your timeline easy to read. At a glance, it should show what happens, when it happens, and what is most important. Use clear labels and keep the spacing even. Avoid putting too much information in one place. Highlight the main milestones, keep less important details in the background, and help the viewer follow the timeline from beginning to end.
Right Structure
A linear timeline works best for straightforward sequences, like onboarding programs or course modules. A Gantt-style timeline is more suitable for complex projects where overlapping tasks and dependencies matter. If you are designing digital learning experiences, consider interactive timeline examples that allow users to explore content at their own pace. And when engagement is a priority, a creative timeline can make a difference. For this purpose, visuals, storytelling, or metaphors are ideal.
Accessibility
Use high-contrast colors and readable fonts, and avoid relying only on color to convey meaning. Timelines should be easy to scan for all users, including those accessing content on different devices or with visual impairments.
How To Make A Timeline In Popular Tools
The right format in timelines can turn a complex learning journey, onboarding plan, or project roadmap into something immediately clear and actionable. Below is a practical breakdown of how to make a timeline across the tools professionals use most, along with when each tool makes the most sense.
PowerPoint: Best For Presentations And Storytelling
If your goal is to present a learning journey, onboarding plan, or project roadmap, PowerPoint is often the most effective option.
How To Create A Timeline In PowerPoint (Step-By-Step)
- Open a blank slide and choose a clean layout.
- Go to Insert → SmartArt → Process.
- Select a timeline-style graphic (e.g., Basic Timeline).
- Add your milestones and dates.
- Customize colors, icons, and spacing to match your brand.
This is the quickest way to create a timeline in PowerPoint, especially for non-designers. For more flexibility:
- Use shapes and lines instead of SmartArt.
- Align elements manually for more control over layout and storytelling.
PowerPoint Timeline Examples To Consider
- Onboarding journey (Week 1 → Month 3)
- Leadership development roadmap
- Project milestone timeline
Excel: Best For Planning, Tracking, And Data-Driven Timelines
Excel is the go-to tool when timelines need to be functional, editable, and tied to data.
How To Make A Timeline In Excel (Step-By-Step)
- Create a table with columns: Task, Start Date, End Date.
- Select your data and insert a Stacked Bar Chart.
- Format the chart so the first series (start date) is hidden.
- Adjust colors and labels to clearly represent duration.
You can also use a ready-made Excel timeline template or a project timeline template in Excel to save time.
When To Use Excel Timelines
- Managing learning program rollouts.
- Tracking content development.
- Coordinating cross-team projects.
Unlike presentation tools, Excel helps you make a timeline that evolves with your project.
Google Docs: Best For Simple, Collaborative Timelines
When speed and collaboration matter, Google Docs is a practical option.
How To Make A Timeline On Google Docs (Step-By-Step)
- Go to Insert → Table and create a 2-row table.
- Use the top row for dates and the bottom row for events.
- Adjust column widths for spacing.
- Add colors or borders for visual clarity.
This is the simplest way to create a timeline in Google Docs without switching tools. You can also:
- Insert drawings for more visual timelines.
- Use bullet points under each milestone for more detail.
A creative timeline in Google Docs works well for:
- Early-stage planning
- Internal documentation
- Collaborative curriculum outlines
Microsoft Word: Best For Documentation And Reports
Microsoft Word is often overlooked, but it is useful for structured, text-based timelines.
How To Make A Timeline In Word (Step-By-Step)
- Go to Insert → SmartArt → Process.
- Choose a simple timeline layout.
- Add your milestones and descriptions.
- Adjust formatting for readability.
Alternatively, you can:
- Use a table format for a clean, linear structure.
- Combine text with icons for visual support.
Word Timeline Examples
- A compliance training rollout timeline included in a report or proposal.
- Word works best when the timeline supports written content rather than leading it.
Canva: Best For Creative And Branded Timelines
For visually engaging and creative timeline ideas, Canva is one of the most accessible tools.
How To Make A Timeline In Canva (Step-By-Step)
- Search for „timeline“ in Canva templates.
- Choose a layout that fits your use case (horizontal, vertical, or infographic style).
- Replace placeholder text with your milestones.
- Customize colors, fonts, and icons to match your brand.
- This is one of the fastest ways to make a timeline that looks professionally designed.
Creative Timeline Examples In Canva
- Learning journey maps with icons and illustrations.
- Interactive-style visuals for presentations.
- Story-driven timelines for company or team evolution.
Best Practices
- Keep visual consistency across slides or assets.
- Use icons to reduce text overload.
- Export for PowerPoint if needed.
Canva is especially useful when you want a creative timeline that stands out in presentations or learning materials.
Creative And Interactive Timeline Examples
Creative timelines are where structure meets storytelling. For Instructional Designers and Learning Experience Designers, this is the moment a simple visual turns into a meaningful learning experience. Instead of relying on static formats, many teams are now exploring creative timeline ideas that make information easier to understand and more engaging to navigate.
Visual Metaphors
For example, an onboarding journey can be presented as a „roadmap,“ where each milestone represents a key stage in the employee experience. This is one of the most practical interactive timeline examples for corporate learning, as it helps new hires see both progress and purpose. Similarly, leadership development programs can be visualized as „growth paths“ that show how skills evolve over time.
Branches
Unlike linear structures, branching timeline examples allow learners to explore different paths based on roles, skills, or decisions. In an LMS environment, this can support personalized learning journeys, which are especially useful for global teams with diverse needs. These types of interactive timeline examples are increasingly used in compliance training and role-based onboarding.
Gamification
Gamification matters. By adding progress indicators, unlockable milestones, or scenario-based checkpoints, organizations can transform passive content into active learning. This approach works particularly well in digital courses, where engagement is critical.
Industry Timeline Examples And Templates
Looking at real-world timeline examples is often what helps ideas click. Let’s explore a few.
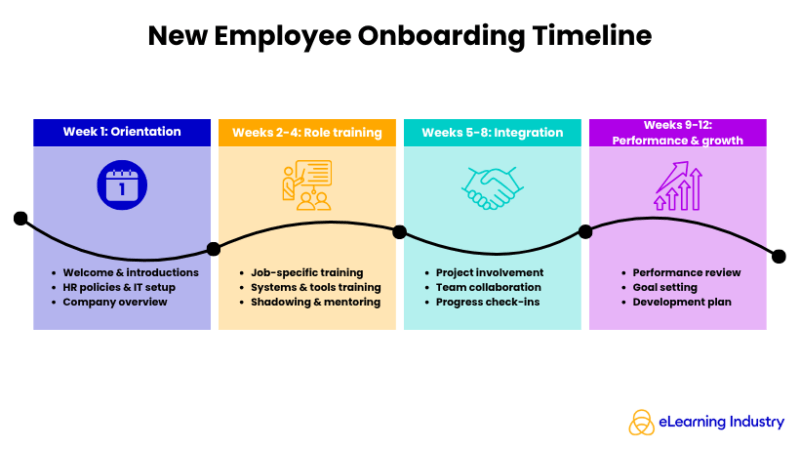
Company Timelines In Onboarding Programs
Many organizations map a new hire’s first 90 days into clear phases: orientation, role training, and performance milestones. This type of structure is a strong example of a timeline that supports both employee experience and business outcomes. It also translates well into LMS environments, where learners can track their progress over time.
Below is an onboarding timeline example created in Canva:
Project-Based Timeline Example
Teams usually rely on an Excel timeline template to visualize deadlines, dependencies, and deliverables. For instance, a leadership training rollout might include phases like content development, pilot testing, and full deployment, all laid out in a simple, trackable format. Many of these templates can be adapted into an Excel timeline calendar for ongoing initiatives.
Presentation Timeline Examples
In PowerPoint, teams often use a timeline slide PowerPoint format to show progress, roadmap milestones, or transformation journeys. These visuals are frequently used in stakeholder updates, where clarity and storytelling matter just as much as data.
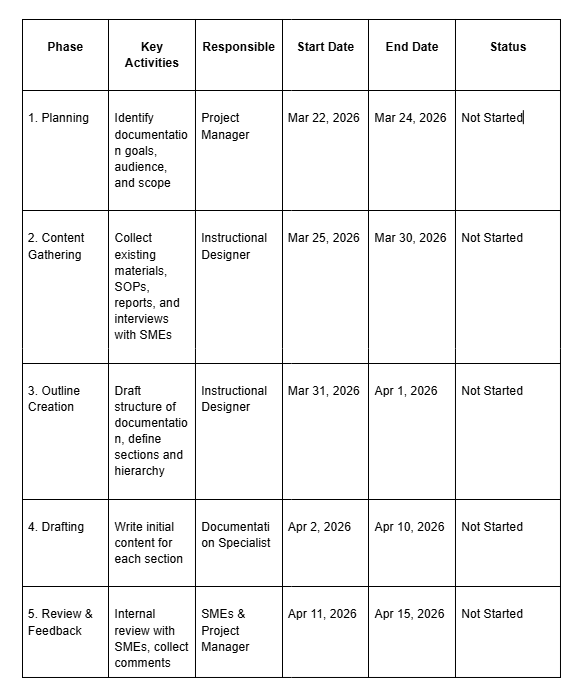
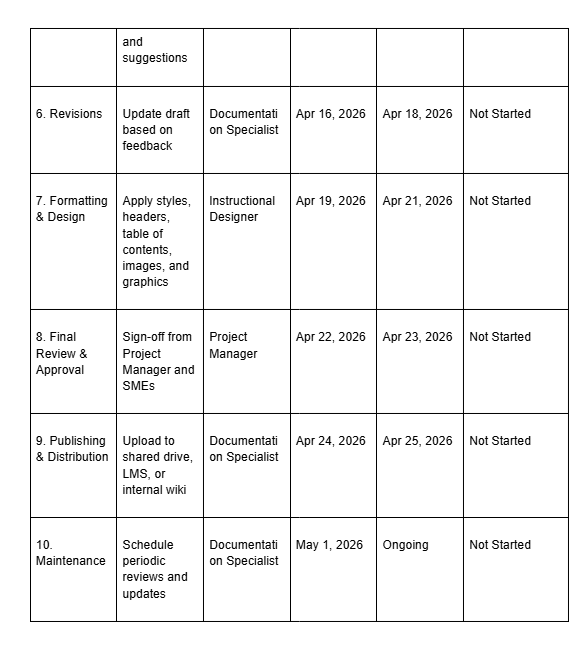
Documentation Process Timelines
For more flexible documentation, tools like Google Docs offer quick ways to create a timeline in Google Docs using tables or simple layouts. While less visual, these formats are effective for collaborative planning and early-stage drafts.
Here is a documentation process timeline example created in Google Docs:
Best Practices For Selecting And Using Timelines
Not all timelines are created equal, and choosing the right type can make a big difference in how your audience understands the information.
Consider Audience And Purpose
For example, a project timeline template in Excel works well for tracking milestones internally, while a presentation timeline example in PowerPoint might be better for leadership updates or training sessions.
Keep Timelines Clear
Whether you’re using a creative timeline, an interactive timeline example, or a simple linear example of a timeline, prioritize readability over decoration. Highlight key milestones and group related events so your audience can follow the story at a glance.
Add Visual Elements
Consider combining your timeline with other visual aids, such as charts, images, or infographics. This can increase engagement and make complex processes easier to understand. The most effective timelines are those that clearly align milestones with outcomes, visually highlight priorities, and engage the audience.
Conclusion
Timelines aren’t just charts; they’re powerful tools for clarifying learning journeys, project plans, and presentations. The best way to see what works is to experiment with different formats and tools. Try linear, Gantt, or creative designs, and test them in PowerPoint, Excel, or Google Docs to find what fits your content and audience. Explore ready-made templates to save time, then customize them to your learning programs or projects. Whether you’re mapping an onboarding flow or designing a course module, using timeline examples strategically helps you communicate clearly and make confident decisions as a learning professional.
Frequently Asked Questions (FAQ) About Timeline Examples
You can use a project milestone timeline in Excel, a course module timeline in PowerPoint, or an onboarding schedule in Google Docs. Each serves a different purpose but helps visualize progress clearly.
Start by listing key events or milestones in chronological order, and choose a simple format such as a linear chart or table. Tools like PowerPoint, Excel, or Google Docs make it easy to create.
Identify the goal, break the process into phases, assign dates or durations, and add key details. Use concise labels and clear visuals for readability.
Include milestones, deadlines, tasks or events, responsible parties, and any dependencies. Optional elements can be notes, visuals, or progress indicators.
Yes. Use tables, shapes, or SmartArt diagrams to map your timeline. Google Docs also allows collaboration and easy sharing.
Use SmartArt > Process diagrams, add milestones, and customize with colors, icons, and animations. This is ideal for presentations or reporting.
Yes. Try branching timelines, interactive slides, or gamified sequences to make learning journeys more engaging and memorable.
Excel project templates, PowerPoint slides, and Google Docs charts are widely used. Choose based on your goal, whether it’s reporting, course design, or project tracking.