
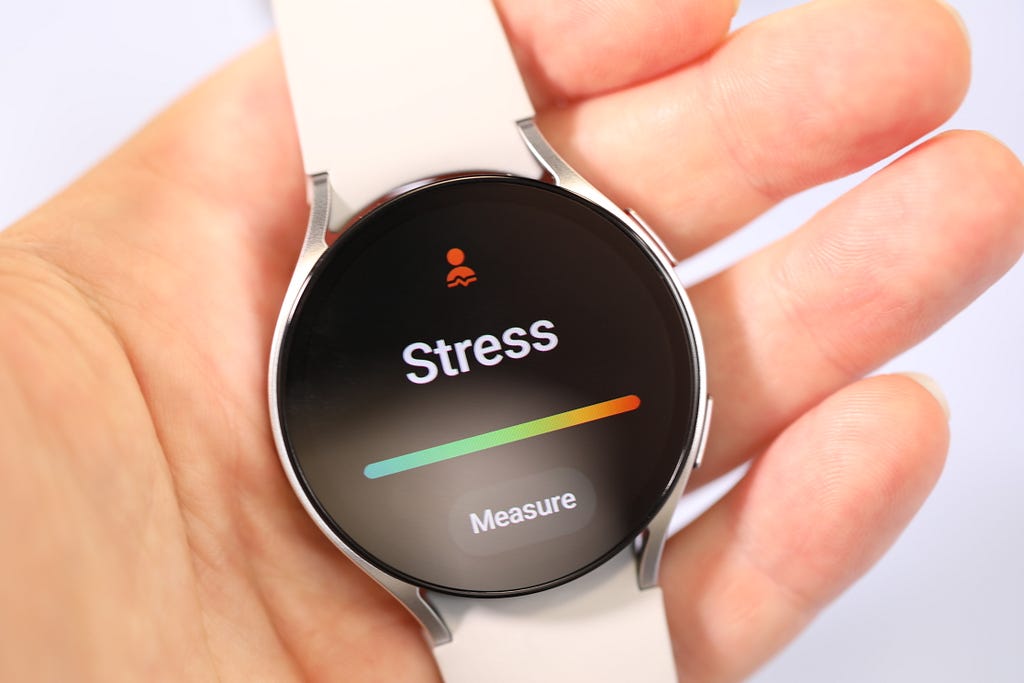
The science and design behind wearable stress tracking

Many wearable devices have moved beyond counting steps and tracking heart rate. Now they are trying to measure something more complicated: stress. Oura sorts parts of your day into states such as Stressed, Engaged, Relaxed, and Restored. Garmin condenses stress into a score from 0 to 100. WHOOP uses a scale from 0 to 3. Some Fitbit devices can notify you when your body shows signs of a possible stress response.
It is impressive that a ring or watch can combine several biological signals and turn something this complicated into a clean graph. But it also raises a few questions. Can stress really be reduced to a number or a state? Does seeing that number lead to meaningful behavior change? And how do people feel about being monitored all day?
First, what is stress?
Psychologists distinguish between the stressors we face, how we perceive them, and how our bodies respond. Crosswell and Lockwood’s overview of stress measurement explains these distinctions. First, there’s the stressor: a situation or demand you face, such as a deadline, an argument, an illness, or a difficult presentation. Then there’s perceived stress: whether you feel that the demand exceeds your ability to cope. Finally, there’s the physiological stress response: what your body does as it prepares to meet that demand.
These aspects of stress influence one another, but they don’t always line up. Performing on stage can make your heart pound and your palms sweat while still feeling exciting rather than distressing. On the other hand, someone may feel overwhelmed without showing the exact bodily pattern a device has learned to associate with stress.
That bodily stress pattern may include a higher heart rate, lower heart rate variability, increased sweating, changes in breathing, and shifts in skin temperature. It isn’t a universal biological definition of stress. It’s a combination of signals that researchers and algorithms have found to occur more often under certain stressful conditions.
Wearables can detect parts of this physiological response. What they can’t directly see is the psychological side: what you’re dealing with and whether you feel able to handle it. That gap matters because feeling overwhelmed is usually what people mean when they say they’re stressed. A device may correctly detect that your body is more activated while still getting your feelings wrong.
How a wearable calculates a stress score
Most rings and watches rely on a small optical sensor that uses photoplethysmography, or PPG. The device shines light into the skin and detects tiny changes in blood volume. From that pulse signal, it estimates your heart rate and the time between beats.
The variation in those intervals is used to estimate heart rate variability (HRV). HRV reflects how the autonomic nervous system regulates the heart. During rest and recovery, the calmer “rest and digest” side of the nervous system tends to have more influence, and the variation between beats is often greater. Under strain or heightened activation, HRV often decreases. A review of 12 studies found this pattern during acute mental stress, supporting the use of HRV as one signal for stress assessment.
When an app reports greater physiological activation, it generally means that your body is showing signs of being more alert or ready for action. Your heart may be beating faster, the intervals between beats may be more regular, your breathing may have changed, or your sweat glands may be more active.
Some devices add another signal: electrodermal activity (EDA). EDA is measured through a dedicated sensor. The sympathetic nervous system activates sweat glands, and even a trace of sweat changes how easily the skin conducts electricity. This makes EDA useful for detecting arousal. However, that arousal could come from stress, excitement, pain, or physical exertion, so EDA alone can’t identify a specific emotion.
After collecting these signals, the software filters out unreliable data, extracts useful patterns, and translates the results into a score or category. Some systems use a general model trained on data from many people, while others also compare your current readings with your own recent patterns.

Why the result is not always right
HRV, EDA, heart rate, and skin temperature can be affected by many factors, including caffeine, illness, excitement, and stress. These influences often overlap, and without context, a wearable can’t reliably tell what caused a change.
Physiological stress isn’t always emotional stress
In everyday speech, “I’m stressed” usually means “I feel mentally pressured or overwhelmed.” In many wearable interfaces, it means something closer to “your body is showing fewer signs of relaxation than usual.” Those aren’t the same thing.
A human-computer interaction paper argues that companies take physiological information that is relatively easy to collect and present it as if it were a complete measure of stress. As a result, a reading can make sense physiologically while misrepresenting how someone feels.
A 28-day study of 95 young adults illustrates this ambiguity. Garmin’s Stress Score was reliably lower when participants reported feeling calm or relaxed. However, higher scores aligned with some energetic, positive moods rather than the highly activated, negative moods the researchers had expected. In other words, the watch was better at detecting that the body was “not relaxed” than at determining whether the person actually felt stressed. The authors concluded that “Stress Score” was a misleading name.
Users don’t live in a laboratory
Stress detection often looks impressive in the lab. Researchers can ask participants to rest and then complete a difficult mental arithmetic task or give a speech. Because the researchers created the stressful condition, they have a relatively clear reference point for interpreting the sensor data.
Real life is much messier. You might be walking, digesting lunch, drinking coffee, and concentrating hard, sometimes all at once. Devices may also lose data because of movement, loose contact, cold skin, or poor circulation. People differ in age, medication use, health, baseline HRV, and how strongly their bodies react to the same event. Context matters, and a wearable device can’t capture most of it on its own.
What do users actually say?
User experiences are mixed. Some people find that tracking helps them recognize patterns or acknowledge strain they’ve been dismissing. Others find the readings confusing, unhelpful, or stressful.
When the number contradicts how users feel
In online discussions and personal reviews, some Oura users describes a Daytime Stress graph that seems stuck on “Stressed,” even on days when they deliberately take it easy. When a reading repeatedly conflicts with their experience, it can become difficult to know what to trust.
Clearer language could help. “Stress” is more marketable, but labels such as “bodily activation” or “signs of strain” would better communicate what the device measures. If an app uses the word “stress,” it should explain that the reading doesn’t necessarily mean someone feels overwhelmed.

Some devices also ask users to record how they feel, bringing their own experience into the picture. For example, Fitbit can prompt users to log their mood after detecting a possible body response. This creates an opportunity to reflect, but the timing and frequency matter. Some users find repeated prompts annoying or say the notifications themselves make them feel more stressed.

When there’s no clear next step
For some users, tracking becomes useful when they can connect a reading to everyday experiences: a demanding day at work, drinking alcohol, or taking a quiet walk. But a score alone doesn’t offer much guidance. “Your score is 76” leaves plenty of questions: What caused it? Does it matter? What can I do about it?
Simple tags and brief reflections can help people make sense of an ambiguous graph. An app could highlight possible patterns and suggest a manageable experiment. If readings often rise after poor sleep, for example, it could help the user explore that connection over time without treating it as a proven cause.
When tracking becomes another source of pressure
Some users describe feeling anxious after checking a stress graph. Tracking can become a loop: see a spike, worry about it, pay closer attention to the body, and check again. Others stop checking during the workday or stop wearing the device altogether.
Design should leave room for people to step back, with adjustable reminders, optional summaries, and the ability to pause tracking. An interface also shouldn’t imply that lower activation is always better. Oura’s “Engaged” state is an example of this idea: it describes elevated physiological activation that may accompany focus and productivity rather than treating everything outside relaxation as negative. Color choices matter too. A simple green-means-good, red-means-bad scale can reinforce the idea that every increase is something to worry about.
So, can stress really be quantified? Parts of it can, but making sense of those measurements still depends heavily on the user’s context and judgment. A device can detect physiological changes without fully understanding what’s happening in someone’s life, and results from a controlled lab don’t always translate neatly to everyday experience. As the technology evolves, stress detection may become more accurate. For now, thoughtful design, honest communication, and clear explanations can help people make better use of the measurements we already have.
Can stress be quantified? was originally published in UX Collective on Medium, where people are continuing the conversation by highlighting and responding to this story.